‘Whose Court’ clarity: Redesigning a bidding platform.

CQuel Projects Dashboard on laptop showing welcome screen with upcoming meeting and survey cards, plus Focus here now section with three action cards: Choose Your Supplier, Publish Your Brief, and Accept Pricing

Team

Designer, product manager, 3 engineers

Timeline

4 months (Aug 2025 - Nov 2025)

4 months
(May - Aug 2025)

Scope

Product design, user research, design system, branding

Transforming a data-rich platform into a self-serve experience that reduced operations calls by 60%.

CQuel's customers had access to everything –12+ data points per project, real-time metrics, financial models – yet they abandoned the platform and called operations instead. I shadowed 20+ customer calls to understand why, discovering they didn't need more data but interpretation. The redesign focused on one principle: always show whose turn it is and what to do next.

CQuel's customers had access to everything –12+ data points per project, real-time metrics, financial models – yet they abandoned the platform and called operations instead. I shadowed 20+ customer calls to understand why, discovering they didn't need more data but interpretation. The redesign focused on one principle: always show whose turn it is and what to do next.

CQuel's customers had access to everything
–12+ data points per project, real-time metrics, financial models – yet they abandoned the platform and called operations instead. I shadowed 20+ customer calls to understand why, discovering they didn't need more data but interpretation. The redesign focused on one principle: always show whose turn it is and what to do next.

01

The Problem

The platform had everything. Customers used nothing.

Despite full access to 12+ data points, financial models, technical specifications, and real-time metrics per project, customers abandoned the platform and called the ops team instead.

Despite full access to 12+ data points, financial models, technical specifications, and real-time metrics per project, customers abandoned the platform and called the ops team instead.

Their constant questions:

  • "Where are we in the process?"

  • "Whose turn is it?"

  • "What do I need to do next?"

  • "Where are we in the process?"

  • "Whose turn is it?"

  • "What do I need to do next?"

The impact:

Operations spent 60% of their time answering questions the platform already showed.

Before redesign: complex property dashboard with nested projects, multiple data points, price estimates, and tender status requiring users to navigate through layers to find actions

02

Research & Design Approach

What I did:

  • Shadowed 20+ customer calls with the operations team

  • Analysed platform usage patterns and drop-off points

  • Mapped actual customer workflows

  • Tested early concepts with real users

Detailed process flow mapping all project stages from Brief Building through Pricing Agreed, with unlock conditions and status transitions shown on sticky notes

The turning point:

Testing with a sustainability manager revealed the real need:

"What I really need is to see multiple projects in one view – something I can present to senior leaders."

Pattern identified:

Customers weren't asking for more data. They needed narrative clarity– a dashboard that tells them what's happening and what to do next.

03

The Solution

Design approach:

Shift from showing data to providing direction—proactive communication over passive information.

Shift from showing data to providing direction—proactive communication over passive information.

Shift from showing data to providing direction—proactive communication over passive information.

Design principles:

  • "Whose Court" clarity
    Always show who's responsible for the next action (Customer's Action / CQuel's Action / Supplier's Action). No more "who's supposed to do what?"

  • "Whose Court" clarity
    Always show who's responsible for the next action (Customer's Action / CQuel's Action / Supplier's Action). No more "who's supposed to do what?"

  • "Whose Court" clarity
    Always show who's responsible for the next action (Customer's Action / CQuel's Action / Supplier's Action). No more "who's supposed to do what?"

Your Action

Your Action

Your Action

CQuel’s Action

CQuel’s Action

CQuel’s Action

Supplier’s Action

Supplier’s Action

Supplier’s Action

  • Progressive disclosure
    Show essentials first, details on demand. Less information overload.

  • Progressive disclosure
    Show essentials first, details on demand. Less information overload.

  • Progressive disclosure
    Show essentials first, details on demand. Less information overload.

Your next meeting

View all

Date & Time:

13:00 – 14:00

21 Aug 2025

Supplier:

Green Energy Solutions

Project:

Hamburg Office HVAC

Hamburg • TechCorp

  • Proactive status
    Tell customers where they are automatically – don't make them ask 5+ times per project.

  • Proactive status
    Tell customers where they are automatically – don't make them ask 5+ times per project.

  • Proactive status
    Tell customers where they are automatically
    – don't make them ask 5+ times per project.

🔄

Procurement

Responses Gathering

Quotes Prepared

Choose Supplier

Meet Supplier

User journey map showing three phases - Project Setup, Procurement, Finalization - with user stories for each stage from creating brief to finalising price

04

What I Designed

A dashboard that shows customers what needs their attention now, whose turn it is to act, and what to do next – organised around their actual workflow, not our data structure.

CQuel Projects Dashboard on laptop showing welcome screen with upcoming meeting and survey cards, plus Focus here now section with three action cards: Choose Your Supplier, Publish Your Brief, and Accept Pricing
Solar PV project detail page showing three-phase progress tracker (Project Setup, Procurement, Finalisation), Focus Here current action, and Coming Up Next steps with responsibility labels
All Projects dashboard showing 23 uploaded plans, 7 published briefs, 5 active tenders, 2 accepted contracts with project table displaying next steps and responsibility assignments
CQuel dashboard components: document submission success, supplier proposal card with price breakdown, latest updates, and Focus Here action items with responsibility tags

02

Testing

Rapid Prototyping: Testing Before Building

The constraint:

Limited dev resources and tight timeline – we couldn't afford to build the wrong thing.

My Process:

  1. Designed in Figma

  2. Built functional prototype in Cursor

    • Fully clickable with realistic data

    • Good enough to demo to real clients

  3. Tested with customers while CEO used it for sales

Success modal showing Contract accepted successfully with next steps checklist and Download Contract button

What happened:

  • The prototype became our sales tool:
    CEO presold the platform before development started

  • Real clients shaped the product:
    Tested with 5+ customers, iterating based on actual reactions

  • Features emerged from user needs:

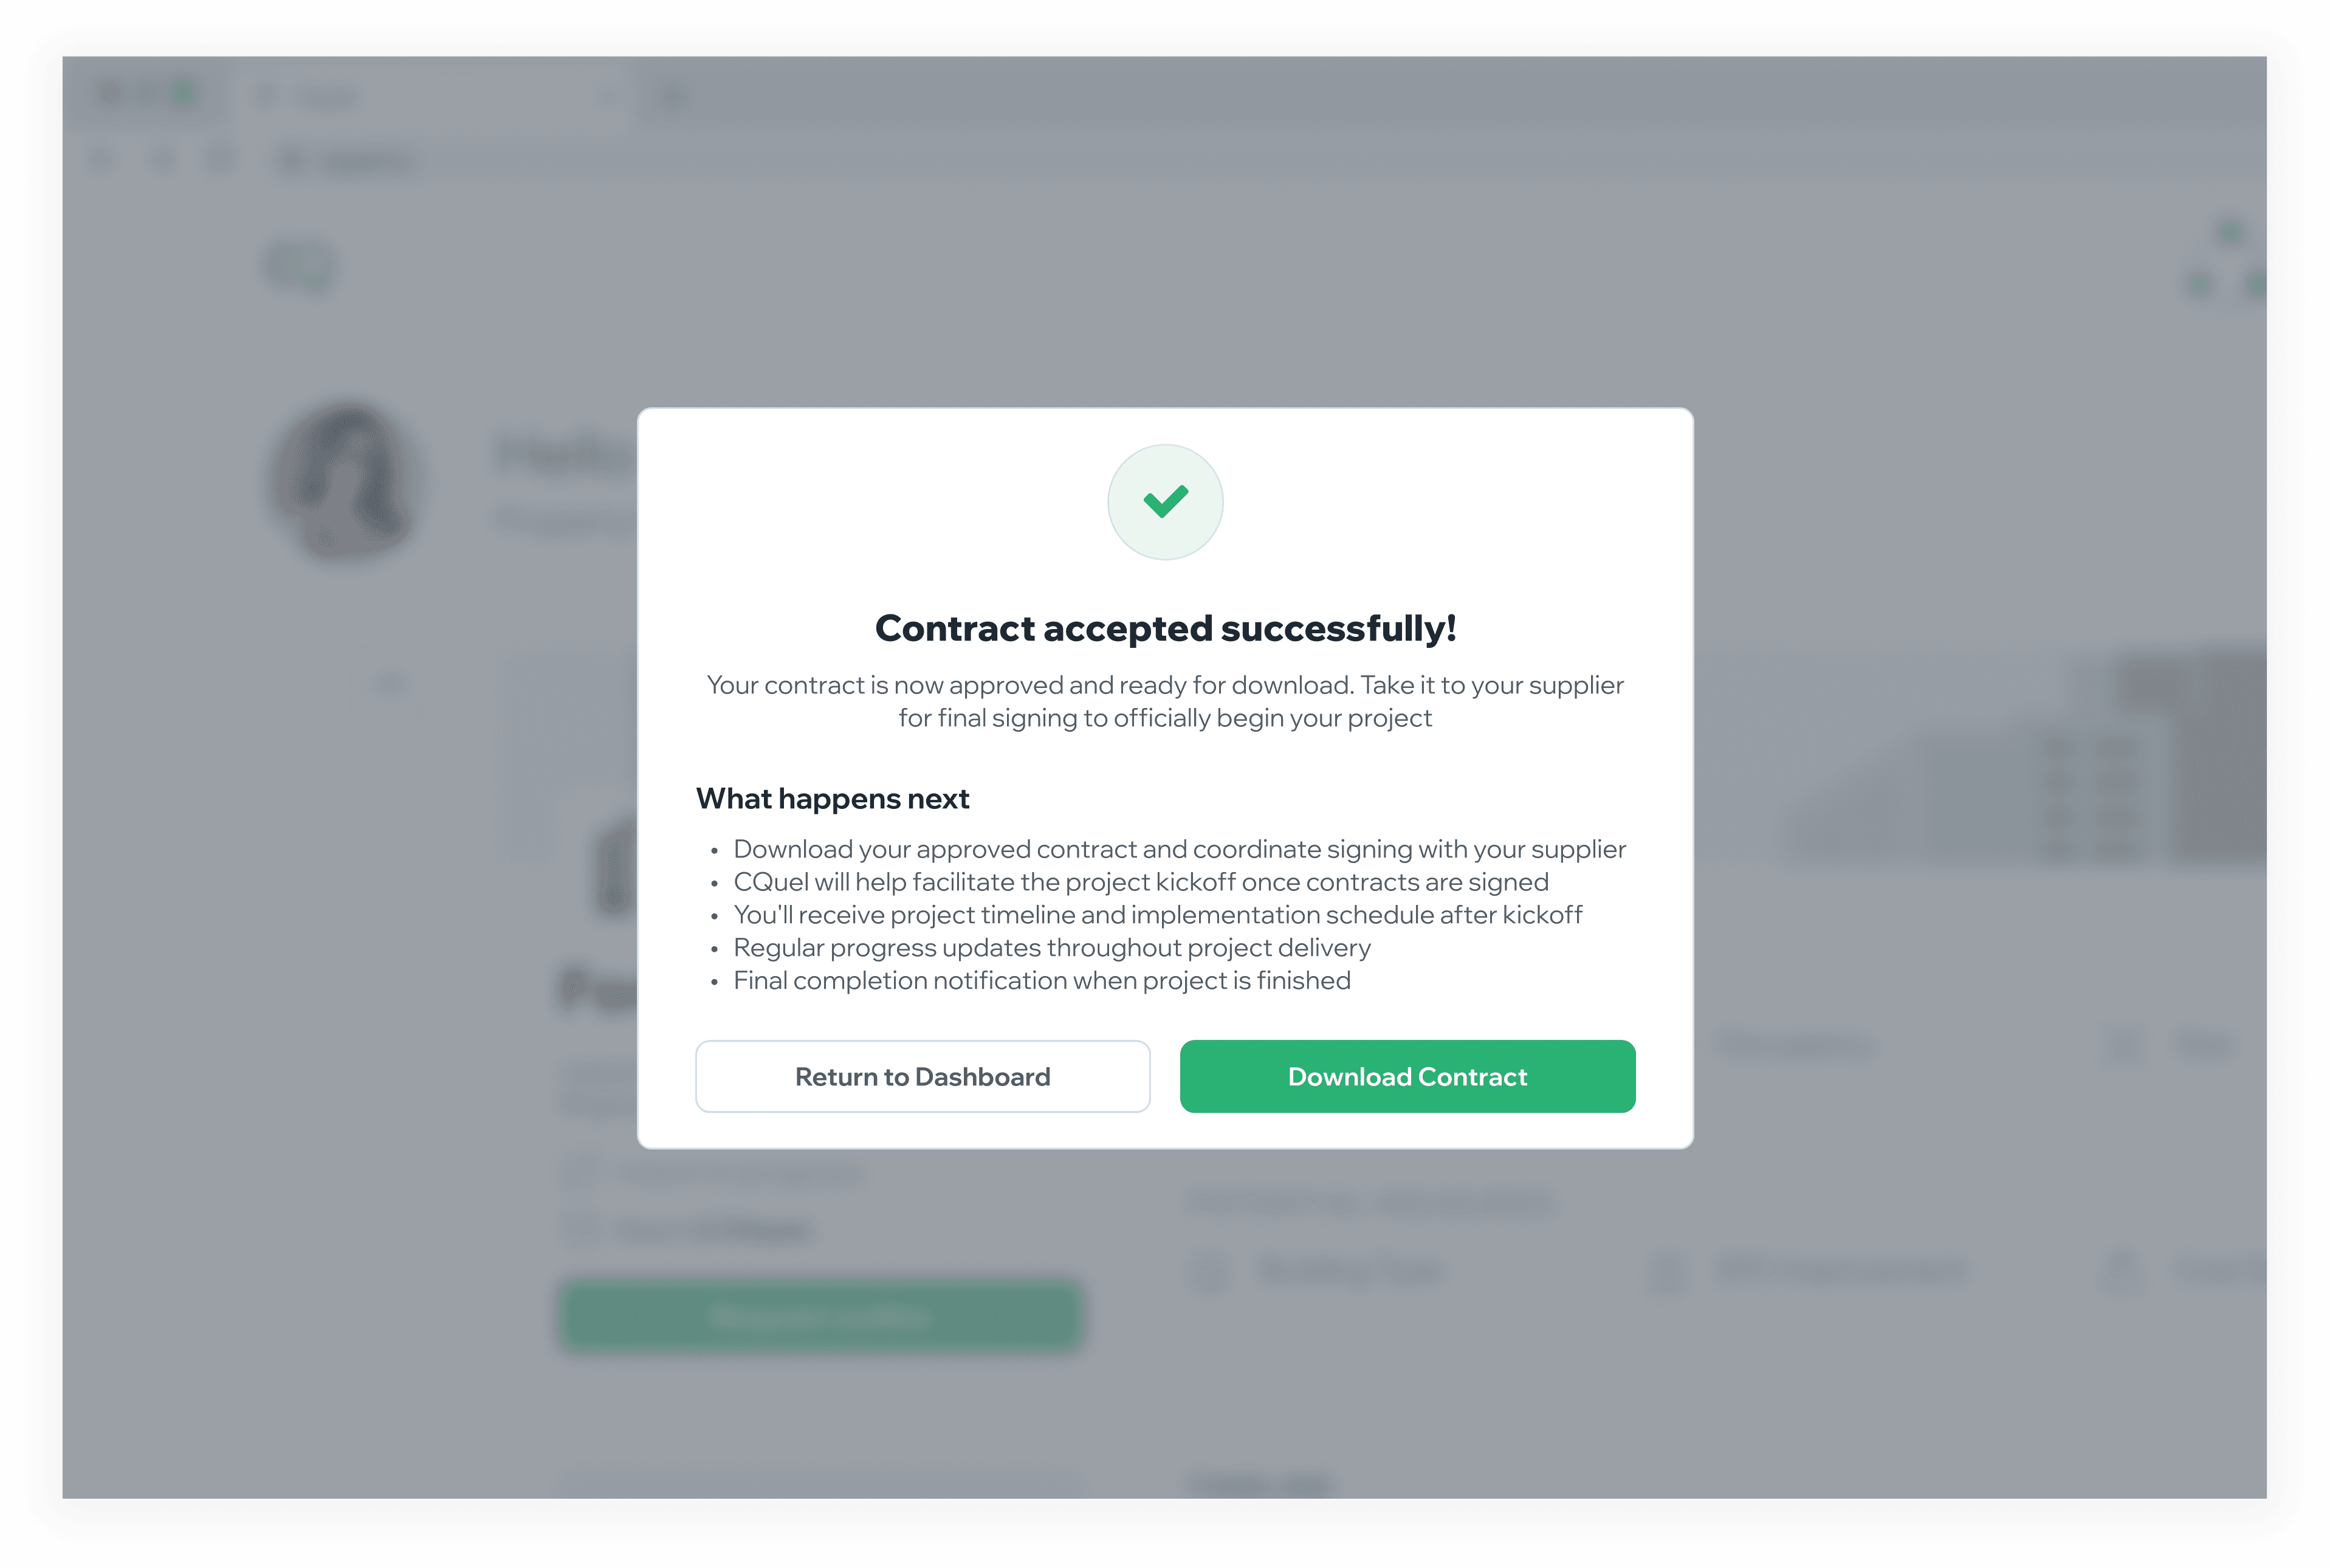
"If you can show me this, can I also sign here?"
Added contract signing based on this single question

The win:

Validated the redesign, shaped the roadmap, and closed deals – all before writing production code.

05

Impact

  • Reduced operational burden:
    60% reduction in status inquiry emails to ops team

  • Customer adoption:
    Existing customers now log in regularly instead of calling – report feeling more in control

  • Business enablement:
    CEO presold platform using functional prototype before dev shipped the real version

Platform shipped Q3 2025, currently used by pilot customers

06

Key Learnings

  • Prototype first:
    5 days building a functional prototype saved weeks of development and became a sales tool.

  • Clarity over data:
    Customers had access to everything but felt lost. The solution was interpretation, not more information.

  • Design principles over features
    "From reactive to proactive" and "whose court" became our north star. Every feature decision ran through these principles.